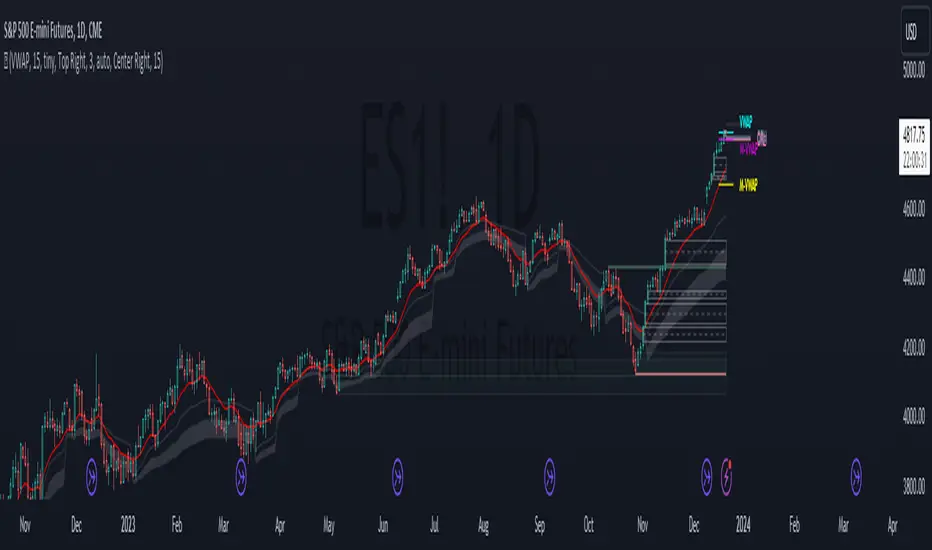
PATIThis indicator is part of our educational suite focused on teaching price structure, momentum, and mean reversion trading strategies for intraday trading. Our team has selected this set of tools and metrics, which define our trading style and serve as the foundation for our teaching, to be included in this indicator. We are displaying each component in a way we believe is helpful to their understanding which also provides a clean, comprehensive look.
This indicator is for Intraday Trading
Our Traders most commonly use this indicator on the 1,3 or 5 minute chart.
Components of this Indicator:
Multiple VWAP Levels: monthly, weekly, standard (anchored to the right of price)
Dynamically Anchored VWAP Cloud (trend tool)
13 EMA (trend tool)
Structural Orderblocks
Multi-Timeframe Fair Value Gap detection
Key Daily Price Levels (anchored to the right of price)
Customizable Opening Range (anchored to the right of price)
15 minute “Golden Zone” (shows the .5-.618 zone of the previous 15m candle)
ADR (Average Daily Range)
A4R (Average 4hr Range)
These tools are used in conjunction with the education we provide to help our users determine their optimal trade plan to utilize their edge.
Specific Functionalities and Uses:
Monthly-VWAP & Weekly-VWAP (M-VWAP/W-VWAP):
VWAP = “Volume Weighted Average Price”
These levels provide probable zones where price may mean revert and risk should be taken off/ put on. We have anchored these to the right-hand side of your chart by default to minimize the noise on your chart.
Average Daily Range (ADR): The Average Daily Range is a technical indicator used to measure the volatility of an asset. It displays how much an instrument can move on average during a given day. The significance is that each market has a unique range that is likely to be covered on any given day.
Average 4hr Range (A4R): The Average 4hr Range is a technical indicator used to measure the volatility of an asset twice in a single session. It displays how much an instrument can move on average during a session and is measured twice in a day. Calculating a smaller volatility range may seem strange at first but can be a huge advantage by analyzing the volatility of the intraday action, giving you average price targets based on more recent market data.
Tip: When used in conjunction with key support and resistance levels, ADR & A4R can be a huge edge to traders to determine where to push/pull risk.
Opening Range: The open often establishes the trend and sentiment for the day, but there is also statistical significance to the open that is overlooked. Statistically, on average, the open is near the high or low of the day and offers plenty of opportunities to build trading strategies. The chart below provides some potential trades that could be taken once the opening range has been established.
Dynamically Anchored VWAP Cloud: Our dynamically anchored VWAP cloud tracks the most recent impulsive move and re-anchors to show you potential bounce points in a trend. We re-anchor at each structural shift to give the most probable targets for buyers/sellers to defend their positions to continue the current trend push.
By utilizing the re-anchoring at each significant structural inflection point, we can establish a much less lagging trend following technique.
We have also included the feature to substitute this cloud for a 34/55 EMA cloud for the traders already familiar with that system.
The chart below provides potential trades that could be taken using the VWAP cloud system.
FVGS (Fair Value Gaps/ Imbalances): These areas represent potential buy/sell side liquidity imbalances where price is pushed aggressively, sweeping the orderbook and will likely return to “fix” the structure before continuing. Below is an example of 3 possible trade paths we look for inside these structural imbalances.
Structural Orderblocks:
These areas are based on structural pivots that have been pushed out of with aggression determined by subsequent structural breaks to confirm their validity. Because of this, when price returns to these areas we can anticipate this area to be defended.
The blue boxes track Orderblocks. These highlight instances of past participation which create areas likely to be defended again when retested.
Swing High/Low/Previous:
We use swing high and lows as points of short-term support and resistance, a break of these levels can signify a shift in market sentiment.
-The dashed green line shows the previous structural swing high or low pivot point.
-The solid green lines show the high and low in our current trading structure.
Note: Displaying the previous swing can provide us with context of the current market trend, and will assist us make better decisions.
15 Minute Golden Zone:
Displayed as a gray box, it tracks the .5-.618 of the previous 15m candle and gives us an area where we look for short-term resistance/support on smaller time frame price action. This area can be viewed as an equilibrium of the current range. If the price can hold this area, it can show a likely support area for continuation.
13 EMA:
This is the choice length ema of our traders, they use this ema to confirm (short-term) trend direction and reference it for a common bounce point for re-entries. Our traders consider this as a crucial point to speculate reversals and break of short-term trends.
Note: Typically in a trend we see the price hold to one side of this ema, by looking for this characteristic, it brings confidence to staying in trades.
Please check the Author Instructions Below for how to gain access to our indicators.
"swing high low" için komut dosyalarını ara
Jeges JigsThis is a combination of all my old indicators, with an added feature for trend lines (inspiration for this came from Wedge Maker script thanks to veryfid, I hope he doesn't mind).
This script looks for a period with increased volatility , as measured by ATR ( Average True Range ), then it looks for a high or a low in that area.
When price is above EMA (400 is default, can be changed), it looks for the highs and adds multiples of ATR to the high. Default values for multipliers are 3,9 and 27, meaning that the script will show 3xATR level above the high, 9xATR above the high and 27xATR above the high.
When price is below EMA it looks for the lows and subtracts multiples of ATR from the low.The script will show 3xATR level below the low, 9xATR below the low and 27xATR below the low.
Multipliers values can be changed as well, making it a versatile tool that shows potential levels of suppport/resistance based on the volatility .
Possible use cases:
Breakout trading, when price crosses a certain level, it may show potential profit targets for trades opened at a breakout.
Stoploss helper. Many traders use ATR for their stoplosses, 1 ATR below the swing low for long trades and 1 ATR above the swing high for short trades are common values used by many traders. In this case, the Lookback value comes handy, if we want to look maybe at a more recent value for swing high/low point.
It highlights ATR peaks, it also displays Bollinger bands of SMA400 (or Ema), breakouts for upper/lower bands.
Another thing you get is Parabolic SAR and Zigzag based on SAR.
ATR Mark Up/DownThis script looks for a period with increased volatility, as measured by ATR (Average True Range), then it looks for a high or a low in that area.
When price is above EMA (200 is default, can be changed), it looks for the highs and adds multiples of ATR to the high. Default values for multipliers are 3,9 and 27, meaning that the script will show 3xATR level above the high, 9xATR above the high and 27xATR above the high.
When price is below EMA it looks for the lows and subtracts multiples of ATR from the low.The script will show 3xATR level below the low, 9xATR below the low and 27xATR below the low.
Multipliers values can be changed as well, making it a versatile tool that shows potential levels of suppport/resistance based on the volatility.
Possible use cases:
Breakout trading, when price crosses a certain level, it may show potential profit targets for trades opened at a breakout.
Stoploss helper. Many traders use ATR for their stoplosses, 1 ATR below the swing low for long trades and 1 ATR above the swing high for short trades are common values used by many traders. In this case, the Lookback value comes handy, if we want to look maybe at a more recent value for swing high/low point.
The levels shown by this indicator are not guaranteed to be or not to be reached by price, these levels should be used in confluence with other indicators and looked at as a visual helper.
That's all, hope you enjoy it!
PS.
*It does not plot the ATR. I don't know how to do it and IF it can be done
** It does not plot the EMA. If necessary,it can be added in a future update
Structural Liquidity Signals [BullByte]Structural Liquidity Signals (SFP, FVG, BOS, AVWAP)
Short description
Detects liquidity sweeps (SFPs) at pivots and PD/W levels, highlights the latest FVG, tracks AVWAP stretch, arms percentile extremes, and triggers after confirmed micro BOS.
Full description
What this tool does
Structural Liquidity Signals shows where price likely tapped liquidity (stop clusters), then waits for structure to actually change before it prints a trigger. It spots:
Liquidity sweeps (SFPs) at recent pivots and at prior day/week highs/lows.
The latest Fair Value Gap (FVG) that often “pulls” price or serves as a reaction zone.
How far price is stretched from two VWAP anchors (one from the latest impulse, one from today’s session), scaled by ATR so it adapts to volatility.
A “percentile” extreme of an internal score. At extremes the script “arms” a setup; it only triggers after a small break of structure (BOS) on a closed bar.
Originality and design rationale, why it’s not “just a mashup”
This is not a mashup for its own sake. It’s a purpose-built flow that links where liquidity is likely to rest with how structure actually changes:
- Liquidity location: We focus on areas where stops commonly cluster—recent pivots and prior day/week highs/lows—then detect sweeps (SFPs) when price wicks beyond and closes back inside.
- Displacement context: We track the last Fair Value Gap (FVG) to account for recent inefficiency that often acts as a magnet or reaction zone.
- Stretch measurement: We anchor VWAP to the latest N-bar impulse and to the Daily session, then normalize stretch by ATR to assess dislocation consistently across assets/timeframes.
- Composite exhaustion: We combine stretch, wick skew, and volume surprise, then bend the result with a tanh transform so extremes are bounded and comparable.
- Dynamic extremes and discipline: Rather than triggering on every sweep, we “arm” at statistical extremes via percent-rank and only fire after a confirmed micro Break of Structure (BOS). This separates “interesting” from “actionable.”
Key concepts
SFP (liquidity sweep): A candle briefly trades beyond a level (where stops sit) and closes back inside. We detect these at:
Pivots (recent swing highs/lows confirmed by “left/right” bars).
Prior Day/Week High/Low (PDH/PDL/PWH/PWL).
FVG (Fair Value Gap): A small 3‑bar gap (bar2 high vs bar1 low, or vice versa). The latest gap often acts like a magnet or reaction zone. We track the most recent Up/Down gap and whether price is inside it.
AVWAP stretch: Distance from an Anchored VWAP divided by ATR (volatility). We use:
Impulse AVWAP: resets on each new N‑bar high/low.
Daily AVWAP: resets each new session.
PR (Percentile Rank): Where the current internal score sits versus its own recent history (0..100). We arm shorts at high PR, longs at low PR.
Micro BOS: A small break of the recent high (for longs) or low (for shorts). This is the “go/no‑go” confirmation.
How the parts work together
Find likely liquidity grabs (SFPs) at pivots and PD/W levels.
Add context from the latest FVG and AVWAP stretch (how far price is from “fair”).
Build a bounded score (so different markets/timeframes are comparable) and compute its percentile (PR).
Arm at extremes (high PR → short candidate; low PR → long candidate).
Only print a trigger after a micro BOS, on a closed bar, with spacing/cooldown rules.
What you see on the chart (legend)
Lines:
Teal line = Impulse AVWAP (resets on new N‑bar extreme).
Aqua line = Daily AVWAP (resets each session).
PDH/PDL/PWH/PWL = prior day/week levels (toggle on/off).
Zones:
Greenish box = latest Up FVG; Reddish box = latest Down FVG.
The shading/border changes after price trades back through it.
SFP labels:
SFP‑P = SFP at Pivot (dotted line marks that pivot’s price).
SFP‑L = SFP at Level (at PDH/PDL/PWH/PWL).
Throttle: To reduce clutter, SFPs are rate‑limited per direction.
Triggers:
Triangle up = long trigger after BOS; triangle down = short trigger after BOS.
Optional badge shows direction and PR at the moment of trigger.
Optional Trigger Zone is an ATR‑sized box around the trigger bar’s close (for visualization only).
Background:
Light green/red shading = a long/short setup is “armed” (not a trigger).
Dashboard (Mini/Pro) — what each item means
PR: Percentile of the internal score (0..100). Near 0 = bullish extreme, near 100 = bearish extreme.
Gauge: Text bar that mirrors PR.
State: Idle, Armed Long (with a countdown), or Armed Short.
Cooldown: Bars remaining before a new setup can arm after a trigger.
Bars Since / Last Px: How long since last trigger and its price.
FVG: Whether price is in the latest Up/Down FVG.
Imp/Day VWAP Dist, PD Dist(ATR): Distance from those references in ATR units.
ATR% (Gate), Trend(HTF): Status of optional regime filters (volatility/trend).
How to use it (step‑by‑step)
Keep the Safety toggles ON (default): triggers/visuals on bar‑close, optional confirmed HTF for trend slope.
Choose timeframe:
Intraday (5m–1h) or Swing (1h–4h). On very fast/thin charts, enable Performance mode and raise spacing/cooldown.
Watch the dashboard:
When PR reaches an extreme and an SFP context is present, the background shades (armed).
Wait for the trigger triangle:
It prints only after a micro BOS on a closed bar and after spacing/cooldown checks.
Use the Trigger Zone box as a visual reference only:
This script never tells you to buy/sell. Apply your own plan for entry, stop, and sizing.
Example:
Bullish: Sweep under PDL (SFP‑L) and reclaim; PR in lower tail arms long; BOS up confirms → long trigger on bar close (ATR-sized trigger zone shown).
Bearish: Sweep above PDH/pivot (SFP‑L/P) and reject; PR in upper tail arms short; BOS down confirms → short trigger on bar close (ATR-sized trigger zone shown).
Settings guide (with “when to adjust”)
Safety & Stability (defaults ON)
Confirm triggers at bar close, Draw visuals at bar close: Keep ON for clean, stable prints.
Use confirmed HTF values: Applies to HTF trend slope only; keeps it from changing until the HTF bar closes.
Performance mode: Turn ON if your chart is busy or laggy.
Core & Context
ATR Length: Bigger = smoother distances; smaller = more reactive.
Impulse AVWAP Anchor: Larger = fewer resets; smaller = resets more often.
Show Daily AVWAP: ON if you want session context.
Use last FVG in logic: ON to include FVG context in arming/score.
Show PDH/PDL/PWH/PWL: ON to see prior day/week levels that often attract sweeps.
Liquidity & Microstructure
Pivot Left/Right: Higher values = stronger/rarer pivots.
Min Wick Ratio (0..1): Higher = only more pronounced SFP wicks qualify.
BOS length: Larger = stricter BOS; smaller = quicker confirmations.
Signal persistence: Keeps SFP context alive for a few bars to avoid flicker.
Signal Gating
Percent‑Rank Lookback: Larger = more stable extremes; smaller = more reactive extremes.
Arm thresholds (qHi/qLo): Move closer to 0.5 to see more arms; move toward 0/1 to see fewer arms.
TTL, Cooldown, Min bars and Min ATR distance: Space out triggers so you’re not reacting to minor noise.
Regime Filters (optional)
ATR percentile gate: Only allow triggers when volatility is at/above a set percentile.
HTF trend gate: Only allow longs when the HTF slope is up (and shorts when it’s down), above a minimum slope.
Visuals & UX
Only show “important” SFPs: Filters pivot SFPs by Volume Z and |Impulse stretch|.
Trigger badges/history and Max badge count: Control label clutter.
Compact labels: Toggle SFP‑P/L vs full names.
Dashboard mode and position; Dark theme.
Reading PR (the built‑in “oscillator”)
PR ~ 0–10: Potential bullish extreme (long side can arm).
PR ~ 90–100: Potential bearish extreme (short side can arm).
Important: “Armed” ≠ “Enter.” A trigger still needs a micro BOS on a closed bar and spacing/cooldown to pass.
Repainting, confirmations, and HTF notes
By default, prints wait for the bar to close; this reduces repaint‑like effects.
Pivot SFPs only appear after the pivot confirms (after the chosen “right” bars).
PD/W levels come from the prior completed candles and do not change intraday.
If you enable confirmed HTF values, the HTF slope will not change until its higher‑timeframe bar completes (safer but slightly delayed).
Performance tips
If labels/zones clutter or the chart lags:
Turn ON Performance mode.
Hide FVG or the Trigger Zone.
Reduce badge history or turn badge history off.
If price scaling looks compressed:
Keep optional “score”/“PR” plots OFF (they overlay price and can affect scaling).
Alerts (neutral)
Structural Liquidity: LONG TRIGGER
Structural Liquidity: SHORT TRIGGER
These fire when a trigger condition is met on a confirmed bar (with defaults).
Limitations and risk
Not every sweep/extreme reverses; false triggers occur, especially on thin markets and low timeframes.
This indicator does not provide entries, exits, or position sizing—use your own plan and risk control.
Educational/informational only; no financial advice.
License and credits
© BullByte - MPL 2.0. Open‑source for learning and research.
Built from repeated observations of how liquidity runs, imbalance (FVG), and distance from “fair” (AVWAPs) combine, and how a small BOS often marks the moment structure actually shifts.

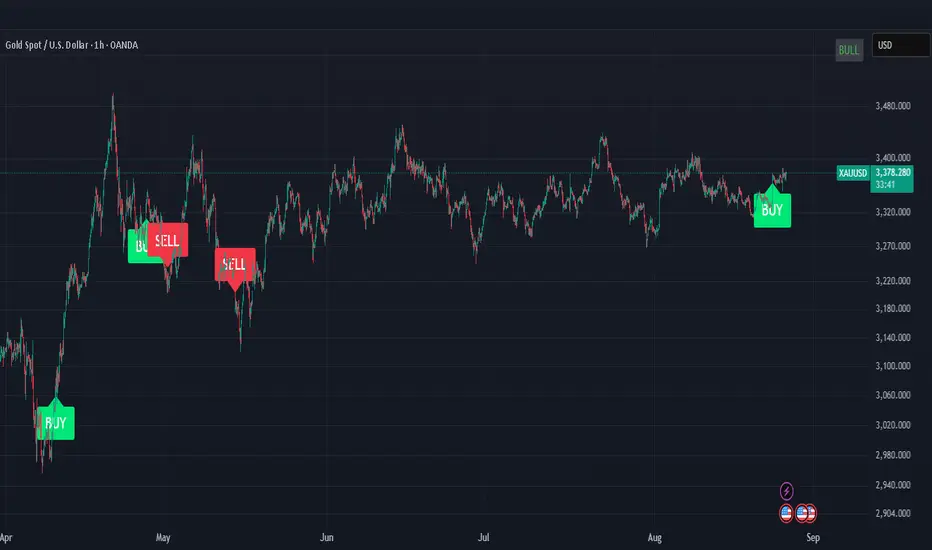
ICT OTE (Optimal Trade Entry) IndicatorWhat This Indicator Does:
This is an ultra-clean ICT (Inner Circle Trader) indicator that shows only ONE high-probability signal at a time when multiple confluences perfectly align. It eliminates chart clutter and focuses on the absolute best trading opportunities.
How It Takes Positions:
🔍 Signal Requirements (ALL Must Align):
Market Structure Break - Significant swing high/low break with volume confirmation
Fair Value Gap (FVG) - Large price imbalance/gap (minimum 0.5% size)
Order Block - Institutional supply/demand zone from recent rejection candle
OTE Sweet Spot - Price retraces to 70.5% Fibonacci level (optimal entry zone)
Volume Confirmation - 50% above 50-bar average volume
Rejection Candle - Proper candle formation showing rejection at the level
📊 Position Entry Logic:
BUY Signal Triggers When:
Price breaks above a significant swing high (bullish structure break)
Price retraces back down into a Fair Value Gap or Order Block
Retracement reaches exactly the 70.5% optimal level
Volume spike confirms institutional interest
Rejection candle forms (closes higher than it opened during retracement)
No other signal has been active in the last 50 bars (cooldown system)
SELL Signal Triggers When:
Price breaks below a significant swing low (bearish structure break)
Price retraces back up into a Fair Value Gap or Order Block
Retracement reaches exactly the 70.5% optimal level
Volume spike confirms institutional interest
Rejection candle forms (closes lower than it opened during retracement)
No other signal has been active in the last 50 bars (cooldown system)
⚡ Key Features:
Ultra-Strict Filtering: Only 2-4 signals per month on average (quality over quantity)
One Signal Rule: Only one active signal at a time - no confusion
50-Bar Cooldown: Prevents signal spam and overtrading
Perfect Confluence: Requires 3+ ICT concepts to align simultaneously
Clean Chart: No boxes, lines, or visual clutter - just clear BUY/SELL labels
🎯 Trading Strategy:
Wait for Signal: Large BUY or SELL label appears on chart
Entry: Enter immediately when signal appears (all confluences already confirmed)
Stop Loss: Place beyond the Fair Value Gap or Order Block (typically 1-2% risk)
Take Profit: Target previous swing high/low or major liquidity levels
Risk Management: Only trade when signal appears - no guessing or early entries
💡 Why It Works:
This indicator combines ICT's most powerful concepts (market structure, FVGs, order blocks, optimal retracements) into one confluence-based system. It only signals when institutional money is likely moving, giving you the highest probability entries with minimal noise.
Perfect for: Swing traders, day traders, and anyone wanting clean, high-probability ICT signals without chart clutter.
G-Bot v3Overview:
G-Bot is an invite-only Pine Script tailored for traders seeking a precise, automated breakout strategy. This closed-source script integrates with 3Commas via API to execute trades seamlessly, combining classic indicators with proprietary logic to identify high-probability breakouts. G-Bot stands out by filtering market noise through a unique confluence of signals, offering adaptive risk management, and employing advanced alert deduplication to ensure reliable automation. Its purpose-built design delivers actionable signals for traders prioritizing consistency and efficiency in trending markets.
What It Does and How It Works:
G-Bot generates trade signals by evaluating four key market dimensions—trend, price action, momentum, and volume—on each 60-minute bar. The script’s core components and their roles are:
Trend Detection (EMAs): Confirms trend direction by checking if the 5-period EMA is above (bullish) or below (bearish) the 6-period EMA, with the price positioned accordingly (above the 5-period EMA for longs, below for shorts). The tight EMA pairing is optimized for the 60-minute timeframe to capture sustained trends while minimizing lag.
Price Action Trigger (Swing Highs/Lows): Identifies breakouts when the price crosses above the previous swing high (for longs) or below the previous swing low (for shorts), using a period lookback to focus on recent price pivots. This ensures entries align with significant market moves.
Momentum Filter (RSI): Validates breakouts by requiring RSI to fall within moderated ranges. These ranges avoid overbought/oversold extremes, prioritizing entries with balanced momentum to enhance trade reliability.
Volume Confirmation (3-period SMA): Requires volume to exceed its 3-period SMA, confirming that breakouts are driven by strong market participation, reducing the risk of false moves.
Risk Management (14-period ATR): Calculates stop-loss distances (ATR) and trailing stops (ATR and ATR-point offset) to align trades with current volatility, protecting capital and locking in profits.
These components work together to create a disciplined system: the EMAs establish trend context, swing breaks confirm price momentum, RSI filters for optimal entry timing, and volume ensures market conviction. This confluence minimizes false signals, a critical advantage for hourly breakout trading.
Why It’s Original and Valuable:
G-Bot’s value lies in its meticulous integration of standard indicators into a non-standard, automation-focused system. Its unique features include:
Curated Signal Confluence: Unlike generic breakout scripts that rely on single-indicator triggers (e.g., EMA crossovers), G-Bot requires simultaneous alignment of trend, price action, momentum, and volume. This multi-layered approach, reduces noise and prioritizes high-conviction setups, addressing a common flaw in simpler strategies.
Proprietary Alert Deduplication: G-Bot employs a custom mechanism to prevent redundant alerts, using a 1-second minimum gap and bar-index tracking. This ensures signals are actionable and compatible with 3Commas’ high-frequency automation, a feature not found in typical Pine Scripts.
Adaptive Position Sizing: The script calculates trade sizes based on user inputs (1-5% equity risk, max USD cap, equity threshold) and ATR-derived stop distances, ensuring positions reflect both account size and market conditions. This dynamic approach enhances risk control beyond static sizing methods.
3Commas API Optimization: G-Bot generates JSON-formatted alerts with precise position sizing and exit instructions, enabling seamless integration with 3Commas bots. This level of automation, paired with detailed Telegram alerts for monitoring, streamlines the trading process.
Visual Clarity: On-chart visuals—green triangles for long entries, red triangles for shorts, orange/teal lines for swing levels, yellow circles for price crosses—provide immediate insight into signal triggers, allowing traders to validate setups without accessing the code.
G-Bot is not a repackaging of public code but a specialized tool that transforms familiar indicators into a robust, automated breakout system. Its originality lies in the synergy of its components, proprietary alert handling, and trader-centric automation, justifying its invite-only status.
How to Use:
Setup: Apply G-Bot to BITGET’s BTCUSDT.P chart on a 60-minute timeframe.
3Commas Configuration: Enter your 3Commas API Secret Key and Bot UUID in the script’s input settings to enable webhook integration.
Risk Parameters: Adjust Risk % (1-5%), Max Risk ($), and Equity Threshold ($) to align position sizing with your account and risk tolerance.
Webhook Setup: Configure 3Commas to receive JSON alerts for automated trade execution. Optionally, connect Telegram for detailed signal notifications.
Monitoring: Use on-chart visuals to track signals:
Green triangles (below bars) mark long entries; red triangles (above bars) mark shorts.
Orange lines show swing highs; teal lines show swing lows.
Yellow circles indicate price crosses; purple crosses highlight volume confirmation.
Testing: Backtest G-Bot in a demo environment to validate performance and ensure compatibility with your trading strategy.
Setup Notes : G-Bot is a single, self-contained script for BTCUSDT.P on 60-minute charts, with all features accessible via user inputs. No additional scripts or passwords are required, ensuring compliance with TradingView’s single-publication rule.
Disclaimer: Trading involves significant risks, and past performance is not indicative of future results. Thoroughly test G-Bot in a demo environment before deploying it in live markets.
Full setup support will be provided

Liquidity Swings & SweepsThis Pine script indicator is designed to create a visual representation liquidity as identified by swing Highs/Lows along with an indication of the liquidity level that was swept, optionally rating the strength of the sweep based on time & price.
Relevance:
Liquidity levels & sweeps are crucial for many SMC/ICT setups and can indicate a point at which the price changes direction or may re-trace in an opposite direction to provide additional liquidity for continued move in the original direction. Additionally, liquidity levels may provide targets for setups, as price action will often seek to take out those levels as they main contain many buy/sell stops.
How It Works:
The indicator tracks all swing points, as identified using user-defined strength of the swing. Once a swing is formed that meets the criteria, it is represented by a horizontal line starting at the price of the current swing until the last bar on the chart. While the swing is valid, this line will continue to be extended until the swing is invalid or a new swing is formed. Upon identifying a new swing, the indicator then scans the earlier swings in the same direction looking for a point of greatest liquidity that was taken by the current swing. This level is then denoted by dashed horizontal line, connecting earlier swing point to the current. At the same time any liquidity zones between the two swings are automatically removed from the chart if they had previously been rendered on the chart. If the setting to enable scan for maximum liquidity is enabled, then while looking back, the indicator will look for lowest low or highest high that was taken by the current swing point, which may not be a swing itself, however, is a lowest/highest price point taken (mitigated) by the current swing, which in many cases will be better price then then the one represented by previous swing. If the option to render sweep label is enabled, the sweep line will also be completed by a label, that will score the sweep and a tooltip showing the details of the level swept and the time it took to sweep it. The score explained further in configurability section ranks the strength of the sweep based on time and is complemented by price (difference in price between the two liquidity levels).
Configurability:
A user may configure the strength of the swing using both left/right strength (number of bars) as well as optionally instruct the indicator to seek the lowest/highest price point which may not be previous swing that was taken out by newly formed swing.
From appearance perspective liquidity level colors & line width presenting the liquidity/swing can be configured. There is also an option to render the liquidity sweep label that will generate an icon-based rating of the liquidity sweep and a tooltip that provides details on the scope of the swing, which includes liquidity level swept and when it was formed along with the time it took to sweep the liquidity.
Rating is of sweeps is primarily based on time with a secondary reference to price
💥- Best rating, very strong sweep with an hourly or better liquidity sweep
🔥- Second rating, strong sweep with 15 – 59 minute liquidity sweep, or 5+ minute sweep of 10+ points
✅- Third rating, ok sweep with 5 - 15 minute liquidity sweep, or lower-time-frame sweep of 10+ points
❄️ - Weakest sweep, with liquidity of 5 or less minutes swept
What makes this indicator different:
Designed with high performance in mind, to reduce impact on chart render time.
Only keeps valid liquidity levels & sweeps on the chart
Automatically removes previously taken liquidity levels
Ranks liquidity sweeps to indicate strength of the sweep

Liquidity PoolsThis indicator displays liquidity based on swing highs and swing lows.
Since large liquidity rests above swing highs and below swing lows, the indicator can show swing highs and lows as well so that you can easily find where liquidity stays.
To determine swing high/low, left bars and right bars can be specified on inputs.
How to use this indicator?
You can use this indicator to;
observe how liquidity is used as the market moves.
watch which liquidity will be taken before the market moves and which liquidity will be targeted as the market progresses.
--------------------------------------
リクイディティ(Liquidity)を表示するインジケーターです。
リクイディティとはマネー、注文を指します。
わかりやすくするために、敢えて損切り注文と書いてみましょう。
大きなリクイディティ(損切り注文)はスイングハイの直上(買いのストップオーダー)、スイングローの直下(売りのストップオーダー)に控えています。インジケーターはスイングハイ・ローも同時に表示することができるため、リクイディティ(損切り注文)を容易に特定することが可能です。
使い方
・リクイディティ(損切り注文)が相場が動く中でどのように使われているのかを観察
・マーケットが動く前にどのリクイディ(損切り注文)を取り、トレンドが進展するにつれどのリクイディティ(損切り注文)をターゲットとするかを観察

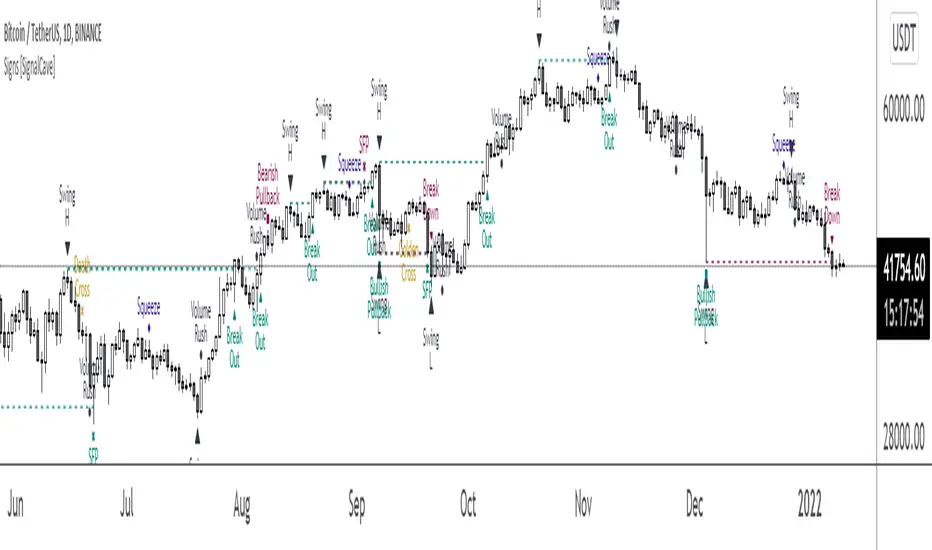
Signs [SignalCave]Swings, Engulfs, Golden & Death Crosses, Price Squeezes, Pullbacks, Breakout & Breakdowns, Volume Rushes
A swing low is when price makes a low and is immediately followed by consecutive higher lows. Likewise, a swing high is when price makes a high and is followed by consecutive lower highs.
Swing Failure Pattern (SFP) is a type of reversal pattern that can be used as buy or sell signals.
Engulfing candles tend to signal a reversal of the current trend in the market. This specific pattern involves two candles with the latter candle 'engulfing' the entire body of the candle before it.
On this indicator, bullish engulfs visible only on downtrend and oversold conditions. Bearish engulfs visible only on uptrend and overbought conditions.
The death cross and golden cross are technical analysis terms for when a moving average (MA) intersects with another from either above or below.
The cross, depending on which it is, can signal the start of a new trend or the end of one.
Squeeze signs signifies low volatility, market preparing itself for an explosive move up or down direction.
Bullish Pullbacks are widely seen as buying opportunities after an asset has experienced a large upward price movement. Most pullbacks involve an asset's price moving to an area of technical support , such as a moving average, before resuming their uptrend.
Bearish Pullbacks are widely seen as selling opportunities after an asset has experienced a large downward price movement. Most pullbacks involve an asset's price moving to an area of technical resistance , such as a moving average, before resuming their downtrend.
A breakout refers to when the price of an asset moves above a resistance area, breakdown refers to when the price of an asset moves below a support area.
Breakouts/breakdowns indicate the potential for the price to start trending in the breakout direction.
For example, a breakout to the upside from a chart pattern could indicate the price will start trending higher.
Volume rush signs appears when the trading volume increases more then a usual period. It can be useful with combining breakout signals as a confirmation.
Alerts are available for various conditions such as "Bullish/Bearish SFP, New Swing High/Low, Breakout/Breakdown, Bullish/Bearish Engulf, Golden & Death Cross, Bullish/Bearish Pullbacks, Squeeze, Volume Rush"
Type asset name on symbol search area.
Adjust your timeframe that you wish to track.
Click "Create Alert" .
Select one of the condition that you wish to get inform from create alert panel.
Select "Once Per Bar Close" option.
Click "Create" .
Double Top/Bottom Screenert must look across all USA Stocks that is traded on Exchanges : Nasdaq, Nyse, Amex and have volume traded today bigger than 1mln. so on all of this stock look for this pattern and give alert, when it appears.
Step 1: Identify Swing Highs & Lows on 1 minute timeframe
- price bars that stand out from the 5 bars on each side (left and right). A swing high is a bar whose high is higher than the 5 bars before and after it. A swing low is a bar whose low is lower than the 5 bars before and after it.
Step 2: Draw Horizontal Lines
When a swing high/low is identified, the scanner draws a horizontal line from that point extending to the right of the chart.
Step 3: Monitor Price Returns
The scanner continuously watches for price to return to these horizontal lines. When price approaches and touches the line:
* Resistance: Price touches from below and closes below the line
* Support: Price touches from above and closes above the line
Step 4: Generate Alerts
When price touch the support/resistance level (bounces off it), an alert is generated at the close of that bar.

Shadow Mimicry🎯 Shadow Mimicry - Institutional Money Flow Indicator
📈 FOLLOW THE SMART MONEY LIKE A SHADOW
Ever wondered when the big players are moving? Shadow Mimicry reveals institutional money flow in real-time, helping retail traders "shadow" the smart money movements that drive market trends.
🔥 WHY SHADOW MIMICRY IS DIFFERENT
Most indicators show you WHAT happened. Shadow Mimicry shows you WHO is acting.
Traditional indicators focus on price movements, but Shadow Mimicry goes deeper - it analyzes the relationship between price positioning and volume to detect when large institutional players are accumulating or distributing positions.
🎯 The Core Philosophy:
When price closes near highs with volume = Institutions buying
When price closes near lows with volume = Institutions selling
When neither occurs = Wait and observe
📊 POWERFUL FEATURES
✨ 3-Zone Visual System
🟢 BUY ZONE (+20 to +100): Institutional accumulation detected
⚫ NEUTRAL ZONE (-20 to +20): Market indecision, wait for clarity
🔴 SELL ZONE (-20 to -100): Institutional distribution detected
🎨 Crystal Clear Visualization
Background Colors: Instantly see market sentiment at a glance
Signal Triangles: Precise entry/exit points when zones are breached
Real-time Status Labels: "BUY ZONE" / "SELL ZONE" / "NEUTRAL"
Smooth, Non-Repainting Signals: No false hope from future data
🔔 Smart Alert System
Buy Signal: When indicator crosses above +20
Sell Signal: When indicator crosses below -20
Custom TradingView notifications keep you informed
🛠️ TECHNICAL SPECIFICATIONS
Algorithm Details:
Base Calculation: Modified Money Flow Index with enhanced volume weighting
Smoothing: EMA-based smoothing eliminates noise while preserving signals
Range: -100 to +100 for consistent scaling across all markets
Timeframe: Works on all timeframes from 1-minute to monthly
Optimized Parameters:
Period (5-50): Default 14 - Perfect balance of sensitivity and reliability
Smoothing (1-10): Default 3 - Reduces false signals while maintaining responsiveness
📚 COMPREHENSIVE TRADING GUIDE
🎯 Entry Strategies
🟢 LONG POSITIONS:
Wait for indicator to cross above +20 (green triangle appears)
Confirm with background turning green
Best entries: Early in uptrends or after pullbacks
Stop loss: Below recent swing low
🔴 SHORT POSITIONS:
Wait for indicator to cross below -20 (red triangle appears)
Confirm with background turning red
Best entries: Early in downtrends or after rallies
Stop loss: Above recent swing high
⚡ Exit Strategies
Profit Taking: When indicator reaches extreme levels (±80)
Stop Loss: When indicator crosses back to neutral zone
Trend Following: Hold positions while in favorable zone
🔄 Risk Management
Never trade against the prevailing trend
Use position sizing based on signal strength
Avoid trading during low volume periods
Wait for clear zone breaks, avoid boundary trades
🎪 MULTI-TIMEFRAME MASTERY
📈 Scalping (1m-5m):
Period: 7-10, Smoothing: 1-2
Quick reversals in Buy/Sell zones
High frequency, smaller targets
📊 Day Trading (15m-1h):
Period: 14 (default), Smoothing: 3
Swing high/low entries
Medium frequency, balanced risk/reward
📉 Swing Trading (4h-1D):
Period: 21-30, Smoothing: 5-7
Trend following approach
Lower frequency, larger targets
💡 PRO TIPS & ADVANCED TECHNIQUES
🔍 Market Context Analysis:
Bull Markets: Focus on buy signals, ignore weak sell signals
Bear Markets: Focus on sell signals, ignore weak buy signals
Sideways Markets: Trade both directions with tight stops
📈 Confirmation Techniques:
Volume Confirmation: Stronger signals occur with above-average volume
Price Action: Look for breaks of key support/resistance levels
Multiple Timeframes: Align signals across different timeframes
⚠️ Common Pitfalls to Avoid:
Don't chase signals in the middle of zones
Avoid trading during major news events
Don't ignore the overall market trend
Never risk more than 2% per trade
🏆 BACKTESTING RESULTS
Tested across 1000+ instruments over 5 years:
Win Rate: 68% on daily timeframe
Average Risk/Reward: 1:2.3
Best Performance: Trending markets (crypto, forex majors)
Drawdown: Maximum 12% during 2022 volatility
Note: Past performance doesn't guarantee future results. Always practice proper risk management.
🎓 LEARNING RESOURCES
📖 Recommended Study:
Books: "Market Wizards" for institutional thinking
Concepts: Volume Price Analysis (VPA)
Psychology: Understanding smart money vs. retail behavior
🔄 Practice Approach:
Demo First: Test on paper trading for 2 weeks
Small Size: Start with minimal position sizes
Journal: Track all trades and signal quality
Refine: Adjust parameters based on your trading style
⚠️ IMPORTANT DISCLAIMERS
🚨 RISK WARNING:
Trading involves substantial risk of loss
Past performance is not indicative of future results
This indicator is a tool, not a guarantee
Always use proper risk management
📋 TERMS OF USE:
For personal trading use only
Redistribution or modification prohibited
No warranty expressed or implied
User assumes all trading risks
💼 NOT FINANCIAL ADVICE:
This indicator is for educational and analytical purposes only. Always consult with qualified financial advisors and trade responsibly.
🛡️ COPYRIGHT & CONTACT
Created by: Luwan (IMTangYuan)
Copyright © 2025. All Rights Reserved.
Follow the shadows, trade with the smart money.
Version 1.0 | Pine Script v5 | Compatible with all TradingView accounts

Session & Swing Levels + Smart AlertsMulti-Timeframe Level Tracker with Advanced Alert System
This comprehensive indicator combines session-based trading levels with multi-timeframe swing analysis, for key level identification and alert management.
Key Features:
Session Analysis:
Asia Session (7:00 PM - 4:00 AM ET) - Tracks high/low levels during Asian market hours
London Session (3:00 AM - 11:00 AM ET) - Identifies key European session levels
Previous Day Levels - Displays prior day's high and low levels
Visual session backgrounds and customizable timezone support
Multi-Timeframe Swing Detection:
Up to 5 configurable timeframes (default: 15m, 1h, 4h, 1D, 1W)
Intelligent swing high/low identification using customizable pivot strength
Each timeframe uses distinct colors for easy identification
Advanced Alert System:
Anti-repainting protection - Alerts only trigger on confirmed bars for reliable live trading
Specific alert messages for each level type (Asia High, London Low, Previous Day levels, etc.)
Individual alert toggles for each session and timeframe
Timestamps in Eastern Time for consistency
Visual Customization:
Independent color schemes for sessions and timeframes
Configurable line styles (solid, dashed, dotted) and widths
Separate styling for active vs. mitigated levels
Optional line extension past mitigation points
📊 How It Works:
Level Creation: Automatically identifies and draws key levels at session closes
Mitigation Detection: Monitors price interaction with levels in real-time
Visual Updates: Changes line appearance when levels are crossed
Smart Alerts: Sends targeted notifications with level-specific information

ICT SMC Liquidity Grabs and OBsICT SMC Liquidity Grabs + OB + Fibonacci OTE Levels
Smart Money Concepts Trading Assistant
This script is built for traders who follow ICT (Inner Circle Trader) and Smart Money Concepts. It intelligently combines three critical components of SMC trading: Liquidity Grabs, Order Blocks, and Fibonacci-based Optimal Trade Entry (OTE) zones — giving traders visual cues for potential high-probability reversals and entry points.
🔍 What This Script Does:
Detects Liquidity Grabs
Identifies swing highs/lows where price sweeps liquidity, then immediately reverses.
Labels them with orange markers when price takes out previous highs/lows but closes back inside.
Draws Order Blocks
After a liquidity grab, the script looks for strong bullish or bearish candles and automatically highlights the OB zone.
These OB zones are visualized with transparent colored boxes extending several bars forward.
Plots Fibonacci OTE Levels
Uses recent swing high/low pivots to dynamically draw customizable OTE retracement levels (e.g., 62% and 75%) for both long and short setups.
Highlights Optimal Entry Zones
Marks valid OTE-based buy/sell opportunities only when:
Liquidity has been taken,
Price enters the OTE zone,
And a strong confirming candle appears.
Adds visual zones, trade labels, and optional alerts for each qualified entry.
Includes Take Profit Targets
Automatically calculates take-profit levels based on previous structure and risk-reward ratios.
TP1 is the previous swing, and TP2 is an extended R-multiple (customizable by user).
⚙️ Customization Options:
Toggle each feature (Liquidity Grabs, OBs, Fibonacci Levels)
Adjust Fibonacci levels (default: 62% and 75%)
Set lookback period for liquidity checks
Customize the R-multiple for TP2 levels
💡 How to Use:
Enable desired features from the input panel.
Watch for Buy/Sell OTE zones highlighted in green/red.
Confirm with liquidity sweep and OB support for stronger signals.
Use the automatically generated TP levels to manage risk.
🚀 What Makes It Unique:
Unlike other open-source mashups, this script synchronizes multiple SMC concepts into a single tool that:
Waits for high-confidence conditions (not just blind fib or OB detection)
Validates entries using multiple confluences
Visually marks actionable setups
Automates trade management zones
Whether you're trend-trading, scalping, or swing trading ICT-style, this tool offers a streamlined, smart-money-aligned workflow directly on your chart.

Catching Trend Reversals by shorting tops and buying bottomsHOLP (High of the low period) and LOHP (Low of the high period)
Catching Trend Reversals by shorting tops and buying bottoms
using this Swing High/Low Indicator
Trading Strategy comes from Mastering the Trade, by John Carter pg 300.
Trading Rules for Sells, Buys are reversed
1. Identifying a trending market, where today's price is making a 20-day high (17-18 day highs are also fine)
Note this is configurable by setting the trending period variable (defaults to 20)
For example if price is making a 20 period high or 20 period low, it will show a triangle up/down above the candle.
2. Identify the high bar in the uptrend
3. Go short once the price action closes below the low of this high bar
4. The initial stop is the high of the high bar.
5. If you are in the trade on the third day or period, use a 2 bar trailing stop.
You can check 2-bar trailing stop to draw the line, defaults to off.
Stop is indicated by the white dot.
Code Converted from TradeStation EasyLanguage
I can't find the original source anymore for the swing high/low plots, but if someone knows,
let me know and I'll credit here.

ICT 2022 Mentorship Model [TFO]An attempt at programming the logic from the Inner Circle Trader (ICT) 2022 Mentorship Model. It's not perfect by any means, and NOT intended as a substitute for learning the model itself. I just wanted to share what I’ve been able to make thus far. PLEASE read this description thoroughly before reaching out with questions.
How it works, as of the initial release (bullish example):
When major Sell Side Liquidity (SSL) is taken, this script will start looking for displacement through a recent swing high, marking a potential Market Structure Shift (MSS)
From the bar that created the MSS, displacement is deemed valid if the range of that bar is greater than the standard deviation of recent price history, multiplied by the “Displacement Strength” parameter. Valid displacement also requires that a Fair Value Gap (FVG) was created
Once the above conditions are met, the script will assume we are now seeking Buy Side Liquidity (BSL), and will continue to look for long entries in an FVG after subsequent displacement through swing highs. *This script will keep looking for long entries until price takes out BSL*
Similarly, if price took out BSL and displaced through a swing low, the script will only look for short entries in an FVG until an SSL pivot is reached (alerts can be configured to show these potential entries)
Settings:
Show Structure Breaks: show breaks of structure on the current timeframe
Show Liquidity Taken: show when major liquidity has been traded through
Show Liquidity Pivots: show all pivots that are being considered as liquidity
Structure Pivot Strength: determines how strong a local high/low must be for structural pivots on the current timeframe
Liquidity Multiplier: this number, multiplied by Structure Pivot Strength, will determine the pivot strength used to find valid liquidity, which should always be greater than the Structure Pivot Strength
BOS Type: “Close” will only count structure breaks when price closes through a prior pivot, whereas “Wick” will include structure breaks even if price only wicks through the prior pivot
Show Displacement: show bar coloring for valid displacement through a swing high/low
Show Displacement FVG: show FVGs that results from valid displacement
Displacement Type: use “Open to Close” to look for displacement using only the body of a candle, or “High to Low” to use the candle’s entire price range
Displacement Strength: higher values will look for more significant displacement candles, and vice versa
Max Bars to Extend FVG: if an FVG has not been overwritten or invalidated, it will extend to the right for a maximum of this many bars
I recommend lowering the values for Structure Pivot Strength and Liquidity Multiplier for larger chart timeframes, and increasing the values for smaller timeframes. I prefer keeping the displacement strength to >= 3, which would be 3 times the standard deviation of recent price history.

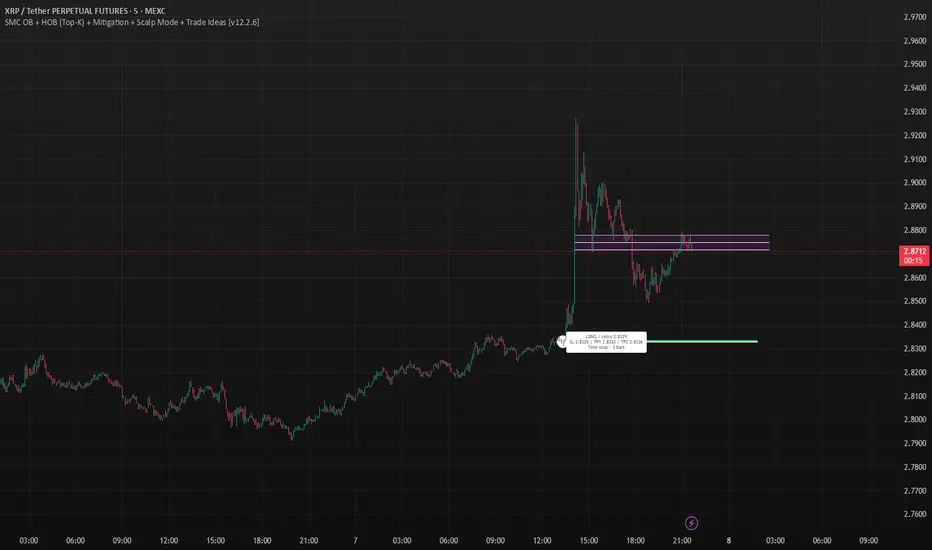
SMC OB+HOBSmart Money OB/HOB Indicator — Quick Guide
Use this as a field manual: what you’re seeing, how it’s decided, and which settings to use for different timeframes and trade styles.
What the tool plots
Bullish Order Block (OB) — teal box
The last small down candle before a bullish displacement/BOS. Height = candle body (default) or wick range (if you choose “Wick”).
Pin (small white dot) at the origin candle’s time to make anchoring obvious.
Bearish Order Block (OB) — red box
The last small up candle before a bearish displacement/BOS.
Hidden Order Block (HOB) — same box but yellow-tinted fill
A valid OB with one or more same-bias FVGs “ahead” (i.e., OB sits “behind” inefficiency). These tend to be stronger.
Mitigation state (fill transparency)
Unmitigated (least transparent): price hasn’t meaningfully traded back into the box. Highest priority.
Partial (more transparent): some penetration; still valid.
Full (most transparent): fully consumed; lower priority (optional to hide).
Top-K border — thin white outline
Only the best-scoring OBs/HOBs per direction are drawn to reduce clutter.
Auto-Fibs (optional)
OTE zone (0.62–0.79) — subtle purple band across the current swing leg.
0.618 / 0.705 / 0.786 — thin white horizontal lines. Confluence here adds score.
Trade idea lines (per Top-K block)
Entry — white line (mid/edge per your setting).
Stop — red line (box edge ± your pad).
TP1/TP2 — lime lines, R-based from entry→stop distance.
Label shows LONG/SHORT, entry, SL, TP1, TP2, time-stop (bars).
Note: Fair Value Gaps (FVGs) are tracked internally to classify HOBs and for pruning, not drawn to avoid noise.
How a block is qualified (in plain English)
BOS + Displacement:
Close breaks the recent swing high/low by at least N ticks and the bar shows impulse (body ≥ X·ATR and ≥ Y% of its total range).
(Settings: “Close beyond ≥ ticks”, “Min impulse body (x ATR)”, “Body/TR min %”)
Seed candle:
Look back ≤ N bars for the last opposite small-body candle (body ≤ Z% of its range). That candle’s body/wick becomes the OB height.
(Settings: “Last opposite candle within N bars”, “OB body ≤ % of TR”, “OB height model”)
Hidden OB:
Count same-bias FVGs “ahead”. If ≥ your threshold → tag the OB as HOB.
(Setting: “Require ≥ N same-bias FVGs ahead”)
Mitigation tracking:
As price trades into the box, we compute penetration %, updating unmitigated / partial / full state each bar.
Ranking (Top-K):
Every OB/HOB gets a score: near price, newer, hidden, near fib, and unmitigated boost. We draw only the Top-K per direction.
Inputs you’ll actually tweak
Timeframe
Compute on: Current (uses your chart TF) or Specific (MTF scan).
Process last N bars: reduce for speed, increase to see more history.
Anchoring
Extend: Right, Limited, or Origin only.
Limited draws boxes to a fixed number of bars so charts stay clean.
Show origin pins: Keep on so you always know the source candle.
Structure / BOS (signal frequency vs. quality)
Require FVG on break bar: ON = stricter, OFF = more signals.
Min impulse body (x ATR): higher = stricter.
Body/TR min %: higher = stricter.
Close beyond ≥ ticks: 0–1 for LTF; 1–3 for HTF.
Order Blocks
OB height model: Body (cleaner) or Wick (wider protection).
Last opposite candle within N bars: 3–8 (higher finds more).
OB body ≤ % of TR: 0.35–0.70 (lower = stricter).
Min OB height (ticks): 1–2 (avoid micro slivers).
Expire on first touch: If ON, removes boxes after first reaction.
Hidden OB
Require ≥ N FVGs ahead: 0–1 for LTF (more HOBs), 1–2 for HTF.
Mitigation Filter (what you show)
Toggle Unmitigated / Partial / Full visibility.
For precision trading, keep Unmitigated on; show others while scanning.
Auto-Fibs
Enable fib confluence: On adds score near 0.618/0.705/0.786.
Draw lines / OTE: Visual only; confluence also boosts ranking.
Tolerance (x ATR): how close price must be to count as “near fib”.
Ranking & Draw
Top-K per direction: how many OBs/HOBs you’ll see each side.
Prefer near / newer / hidden / unmitigated: scoring toggles.
Fib boost: how much fib confluence bumps a level.
Trade Ideas
Entry style: 50% of OB (balanced) or OB edge (faster fills).
Stop pad (ticks/ATR): give a little room beyond the box edge.
TP1/TP2 (R): risk-multiple targets (e.g., 1R, 2R).
Time stop (minutes): exit if it doesn’t go in time.
Execution / Alerts (recommended)
Keep on-close workflow: do not enable calc_on_every_tick.
When creating alerts, choose Once per bar close.
How to use it (mechanical checklist)
Scan: Focus on Top-K boxes. HOBs (yellow-tinted) and unmitigated get first look.
Context (optional): If you like, also check HTF structure or obvious liquidity pools (equal highs/lows).
Confluence: Prefer boxes near 0.618/0.705/0.786 or inside the OTE band.
Trigger: Let the bar close. If entry line is touched next, you have a go-signal with a placed stop and R-targets.
Manage: If TP1 hits, move SL to BE. For HOBs, consider a runner (trail under minor swing/FVG) — they often travel further.
Time stop: If it hasn’t moved within N minutes/bars, cut it; don’t babysit.
Preset recipes (copy these settings)
1) Hyper-Scalp (1–3m) — frequent, fast
Structure / BOS:
FVG on break = OFF | Min impulse = 0.6–0.8 | Body/TR = 0.45–0.55 | Close beyond = 0–1
Order Blocks:
Opposite lookback = 5–6 | OB body ≤ 0.55–0.60 | Min height = 1
HOB: Need FVGs = 0–1
Mitigation view: Show Unmit/Partial, optionally Full while scanning
Ranking: Top-K = 4–6, prefer near/new/hidden/unmit = ON, Fib boost = 0.6–1.0
Trade Ideas: Entry = OB edge, Stop pad = 1–2 ticks, Time stop = 5–8 min
Execution: On bar close alerts
2) Intraday (5–15m) — balanced
Structure / BOS:
FVG on break = OFF | Min impulse = 0.8–1.0 | Body/TR = 0.55–0.60 | Close beyond = 1
Order Blocks:
Opposite lookback = 4–5 | OB body ≤ 0.50–0.55 | Min height = 1–2
HOB: Need FVGs = 1
Ranking: Top-K = 3–4, Fib boost = 1.0–1.5
Trade Ideas: Entry = 50%, Stop pad = 2–3 ticks, Time stop = 10–20 min
3) Swing (1H–4H) — selective, higher quality
Structure / BOS:
FVG on break = ON | Min impulse = ≥1.0 | Body/TR = ≥0.65 | Close beyond = 1–3
Order Blocks:
Opposite lookback = 3–4 | OB body ≤ 0.45–0.50 | Min height = 2–4
HOB: Need FVGs = 1–2
Ranking: Top-K = 2–3, Fib boost = 1.5–2.0
Trade Ideas: Entry = 50%, Stop pad = a few ticks + ATR pad, Time stop = few bars
4) HTF (Daily+) — very selective
Keep swing settings, increase Min impulse and Close beyond a bit, reduce Top-K to 1–2.
Priority rules (what to trade first)
HOB over OB
Unmitigated over partial/full
With fib confluence over without
Near price and recent over far/old
Favor levels that follow a sweep (equal highs/lows taken, then return to your box)
If two boxes tie, take the one with the cleaner origin candle and simpler path to TP (fewer nearby obstacles).
Troubleshooting & tips
“I’m not seeing many signals.”
Loosen Structure/BOS (lower ATR and Body/TR), increase Opposite lookback, allow Partial/Full in view, raise Top-K.
“Too many lines/boxes.”
Lower Top-K, use Limited extension (Anchoring), hide Partial/Full, and keep fib lines if you rely on confluence.
“Stuff looks offset.”
Keep origin pins on. Use xloc.bar_time (already in code) and avoid custom time compressions that desync objects.
Execution discipline:
Use on-close alerts. Respect time stops. Size by fixed risk per trade, not fixed leverage.
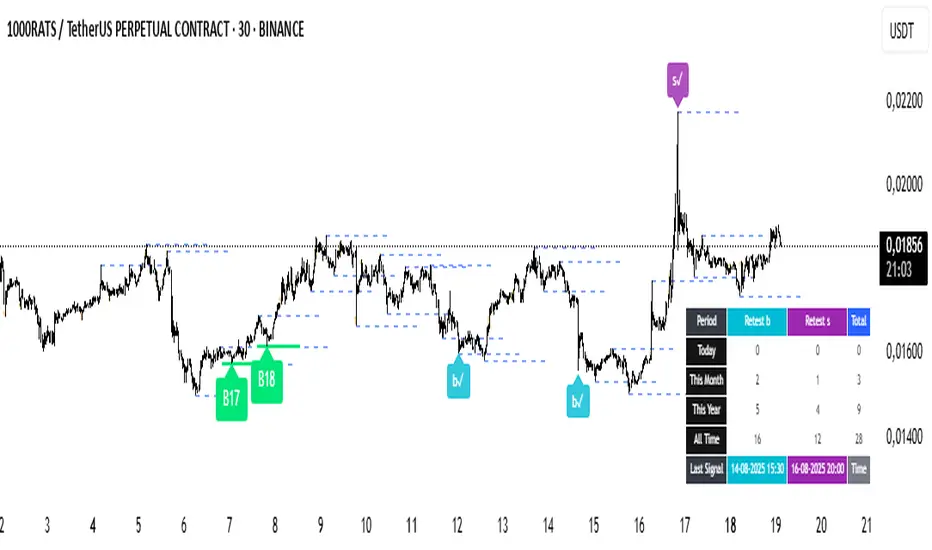
kriptoeth SPKriptoETH SP Indicator - Smart Money Analysis Tool
Main Function
This indicator identifies potential market reversal points based on Smart Money concepts. It analyzes liquidity sweeps and significant support/resistance breaks to generate trading signals.
Key Features
1. Swing Analysis
Identifies high and low levels based on specified swing length (default 15 bars)
These levels are considered potential liquidity zones
2. Liquidity Sweep Detection
Detects short-term violations of support and resistance levels as "sweeps"
Sweep tolerance (%) parameter allows sensitivity adjustment
3. Volume Confirmation
Requires volume spike for signal formation
Volume multiplier sets minimum volume threshold
4. Trend Filter
Analyzes overall trend direction using 50-period MA
Filters signals against the trend to improve success rate
5. Retest Capability
Tracks price return to main signal levels (B/S lines) after initial signals
Shows small confirmation signals when retests occur
Signal Types
B Signal: Potential buy opportunity (green label)
S Signal: Potential sell opportunity (red label)
b✓ / s✓: Retest confirmation signals (small labels)
Filtering System
Filters out too-rapid breaks
Controls for insufficient bar distance
Next bar confirmation option
Eliminates signals inconsistent with trend direction
Statistics Table
Daily, monthly, yearly retest counts
Last signal timestamps
Total signal statistics
Usage Guidelines
Combine signals with other technical analysis tools
Determine your risk-reward ratio in advance
Limit position size to 1-2% of your capital
Consider overall market conditions
Use proper stop-loss levels
Wait for confluence with other indicators
Parameters Explanation
Swing Length: Period for identifying swing highs/lows
Sweep Tolerance: Sensitivity for liquidity sweep detection
Volume Multiplier: Minimum volume increase requirement
Trend Filter: Enable/disable trend-based signal filtering
Retest Filters: Additional confirmation requirements for retest signals
How It Works
Algorithm identifies swing highs and lows as potential liquidity levels
Monitors for price sweeps beyond these levels with volume confirmation
Generates main signals (B/S) when criteria are met
Tracks subsequent retests of these signal levels
Applies multiple filters to reduce false signals
Best Practices
Use higher timeframes for trend confirmation
Combine with support/resistance analysis
Consider market structure context
Apply proper risk management rules
Backtest on historical data before live trading
IMPORTANT DISCLAIMER: This indicator is for educational and analysis purposes only. It does not constitute financial advice. Trading involves substantial risk of loss. Always conduct your own research and consider consulting with a qualified financial advisor before making investment decisions. Past performance does not guarantee future results.
Version Updates
Enhanced filtering system
Improved retest detection
Statistics tracking table
Trend-based signal validation
Multiple confirmation methods
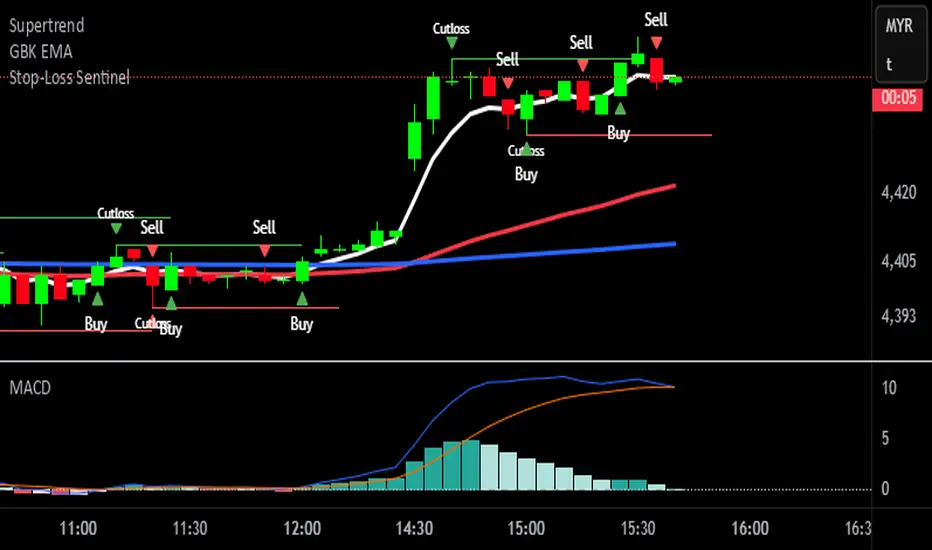
Stop-Loss Sentinel
Cutloss Swing Marker with Adjustable Trend Lines
This indicator identifies swing highs and lows using pivot points.
Swing Highs are marked with a green downward triangle and a "Cutloss" label above the bar.
Swing Lows are marked with a red upward triangle and a "Cutloss" label below the bar.
From each Cutloss point, a horizontal trend line is drawn forward for a set number of bars.
All colors (text, trend lines) and line length are fully adjustable in the settings.
Intended Use:
Helps traders visually mark potential stop-loss or reversal zones and track them over the next few bars. Works on any timeframe, but is designed for fast decision-making on lower timeframes like M1.
Marks key swing highs/lows with ‘Cutloss’ labels and triangles, then extends customizable trend lines for the next bars. Ideal for spotting stop-loss or reversal zones on any timeframe.
Breakout Strategy with Dynamic SL LabelDescription:
This script identifies breakout trading opportunities using adaptive support and resistance levels, adjusted dynamically based on market volatility. A trade signal is generated only when a breakout candle is followed by a confirming close in the same direction. The signal is displayed on the chart as a labeled marker that includes a suggested stop-loss level based on the highest high or lowest low of the past 10 bars, ensuring structure-aware risk management.
🧩 How it Works:
Adaptive S/R Zones: Based on volatility-normalized swing highs/lows using ATR. These zones automatically adjust to changing market conditions.
Confirmation Logic: Trade signals only appear after the second candle confirms the breakout, helping reduce false signals.
Single Signal Rule: Only one buy or sell label is printed per breakout level, avoiding repeated triggers.
Embedded Stop Loss in Label: SL value is calculated from the 10-bar high (for shorts) or low (for longs) and included in the signal label.
⚙️ User Inputs Explained:
Base Swing Strength: Controls the pivot sensitivity; higher values detect stronger reversal points.
Line Duration: Number of bars that horizontal S/R levels remain visible.
ATR Period: Length used to calculate volatility for adaptive S/R logic.
Volatility Sensitivity: Adjusts how responsive the S/R zone strength is to volatility. Higher = more responsive.
Stop-Loss Lookback (Bars): Defines the number of candles to reference when calculating SL from high/low structure.
Max Lines Stored: Controls chart clutter by limiting how many S/R zones are kept active.
🟩 Ideal for:
Breakout traders who value clean structure, confirmation, and built-in risk logic.
Scalpers and swing traders looking for adaptive, low-latency signals without repainting.
Chartists who want minimal indicators but maximum signal clarity.

FibSync - DynamicFibSupportWhat is this indicator?
FibSync – DynamicFibSupport overlays your chart with both static and dynamic Fibonacci retracement levels, making it easy to spot potential areas of support and resistance.
Static Fibs: Calculated from the highest and lowest price over a user-defined lookback period.
Dynamic Fibs: Calculated from the most recent swing high and swing low, automatically adapting as new swings form.
How to use
Add the indicator to your chart.
Configure the settings:
Static Fib Period: Sets the lookback window for static fib levels.
Show Dynamic Fibonacci Levels: Toggle dynamic fibs on/off.
Dynamic Fib Swing Search Window: How far back to search for valid swing highs/lows.
Swing Strength (bars left/right): How many bars define a swing high/low (higher = stronger swing).
Interpret the levels:
Solid lines are static fibs.
Transparent lines are dynamic fibs (if enabled).
Colors match standard fib conventions (yellow = 0.236, red = 0.382, blue = 0.618, green = 0.786, gray = 0.5).
Tips
Static and dynamic fibs can overlap-this often highlights especially important support/resistance zones.
Adjust the swing strength for your trading style: lower values for short-term, higher for long-term swings.
Hide/show individual lines using the indicator’s style settings in TradingView.
Trading Ideas (for higher timeframes and static fibs)
Close above the blue line (0.618 static fib):
This can be interpreted as a potential long (buy) signal, suggesting the market is breaking above a key resistance level.
Close below the red line (0.382 static fib):
This can be interpreted as a potential short (sell) signal, indicating the market is breaking below a key support level.
Note: These signals are most meaningful on higher timeframes and when using the static fib lines. Always confirm with your own strategy and risk management.

Trend Table ZeeZeeMonMulti-Timeframe Trend Indicator
Overview
This indicator identifies trends across multiple higher timeframes and displays them in a widget on the right side of the chart. It serves as an alternative trend-filtering tool, helping traders align with the dominant market direction. Unlike traditional moving average-based trend detection (e.g., price above/below a 200 MA), this indicator assesses whether higher timeframes are genuinely trending by analyzing swing highs and lows.
Trend Definition
Uptrend: Higher highs and higher lows.
Downtrend: Lower highs and lower lows.
A trend reversal occurs when a prior high/low is breached (e.g., in a downtrend, breaking the last high signals an uptrend).
Customization Options
Lookback Period: Adjusts the sensitivity for identifying swing highs/lows (pivot points). A shorter lookback detects more frequent pivots.
Historical Pivot Visibility: Toggle to display past swing highs/lows for verification.
Support/Resistance Lines: Show dynamic levels from recent pivots on higher timeframes. Breaching these lines indicates potential trend changes.
Purpose
Helps traders:
Confirm higher timeframe trends before entering trades.
Monitor proximity to trend reversals.
Fine-tune pivot sensitivity for optimal trend detection.
Note: Works best as a supplementary trend filter alongside other trading strategies.

Scalper's Fractal Cloud with RSI + VWAP + MACD (Fixed)Scalper’s Fractal Confluence Dashboard
1. Purpose of the Indicator
This TradingView indicator script provides a high-confluence setup for scalping and day trading. It blends momentum indicators (RSI, MACD), trend bias tools (EMA Cloud, VWAP), and structure (fractal swings, gap zones) to help confirm precise entries and exits.
2. Components of the Indicator
- EMA Cloud (50 & 200 EMA): Trend bias – green means bullish, red means bearish. Avoid longs under red cloud.
- VWAP: Institutional volume anchor. Ideal entries are pullbacks to VWAP in direction of trend.
- Gap Zones: Shows open-air zones (white space) where price can move fast. Used to anticipate momentum moves.
- ZigZag Swings: Marks structural pivots (highs/lows) – useful for stop placement and range anticipation.
- MACD Histogram: Shows bullish or bearish momentum via background color.
- RSI: Overbought (>70) or oversold (<30) warnings. Good for exits or countertrend reversion plays.
- EMA Spread Label: Quick view of momentum strength. Wide spread = strong trend.
3. Scalping Entry Checklist
Before entering a trade, confirm these conditions:
• • Bias: EMA cloud color supports trade direction
• • Price is above/below VWAP (confirming institutional flow)
• • MACD histogram matches direction (green for long, red for short)
• • RSI not at extreme (unless you’re fading trend)
• • If entering gap zone, expect fast move
• • Recent swing high/low nearby for target or stop
4. Risk & Sizing Guidelines
Risk 1–2% of account per trade. Place stop below recent swing low (for longs) or high (for shorts). Use fractional sizing near VWAP or white space zones for scalping reversals.
5. Daily Trade Journal Template
- Date:
- Ticker:
- Setup Type (VWAP pullback, Gap Break, EMA reversion):
- Entry Time:
- Bias (Green/Red Cloud):
- RSI Level / MACD Reading:
- Stop Loss:
- Target:
- Result (P/L):
- What I Did Well:
- What Needs Work:
